
February 2017
 is a visual communication tool that can serve many purposes. The idea is to capture, organize and illustrate the experience that a group has together, the trajectory of the day, the learnings, insights, themes — or whatever you want to highlight for all — with color, images and words. Some good reasons to create and use a graphic harvest include:
- Visually tells and illustrates the story of what transpired
- Connects with the visual and creative aspects of our brains, thus engaging our WHOLE brain in the process of learning and remembering.
- Conveys more than mere words alone – think, “a picture says a thousand words”
- Appeals to visual learners who make up approximately 65% of the population
- You don’t have to know how to draw or be an artist to do it!
Recently, I’ve seen several examples of graphic harvests created by people we’ve been working with. I love the variation, creativity and communication styles these examples reveal. There are so many different uses of this type of harvest, as these examples illustrate. I’ve also included some links to graphic harvesting products and tools at the end that have been shared with us by others. Let them inspire you!
From Mariah Mariah Leuschen-Lonergan, Public Affairs Specialist for the Custer Gallatin National Forest

The Guster Gallatin National Forest hosted several public meetings as part of their Forest Plan revision process, and used table templates to capture output from the breakout conversations they facilitated. The data was transcribed, themes pulled out, and a comprehensive document was created. Mariah took those themes and drew them on an enlarged version of the table template to create her “visual summary” of the output from the public conversations.
From Oscar Vargas, Superintendent of the Little Tujunga Hotshots at the Angeles National Forest
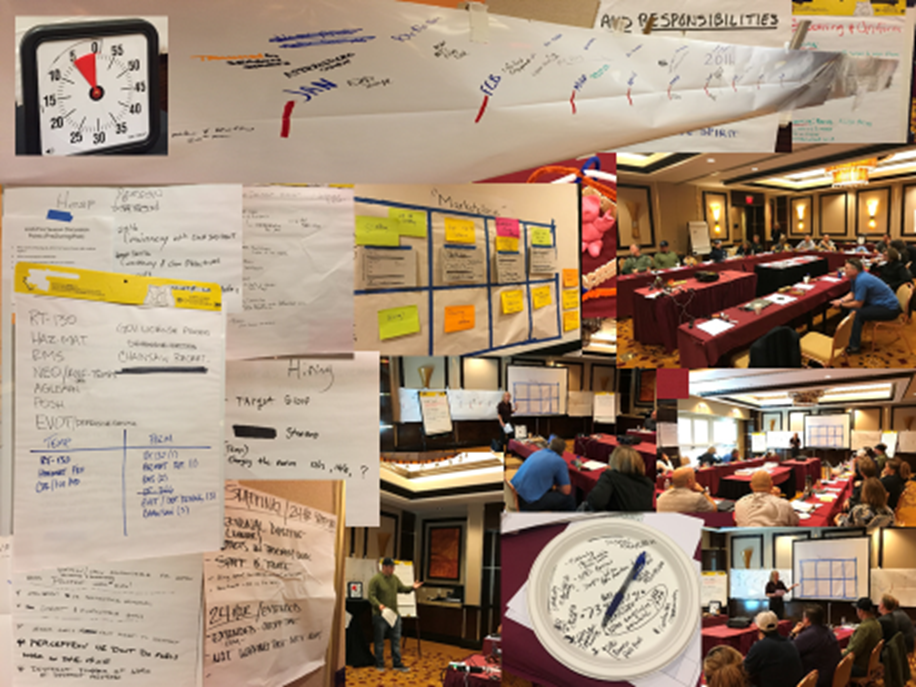
Oscar created this photo collage after a Division Chiefs meeting to reflect the experience they had together. The image acts as a placeholder for the event, giving the viewer as sense of what was covered, the ways they worked together, and some of the process tools used. Simple, engaging and no drawing involved!
From Jennifer Hennigan and Angie Bell at the Chattahoochee Oconee National Forest.

These “visual representations” were created from a stakeholder workshop as part of forest plan revison work. These flip charts were created from the data each day, and illustrate beautifully who was there and what kinds of topics were raised.

The second image is a work in progress, but is a nice example of “planning a harvest.” The topics are laid out with room to add the output for each topic. These can be shared with the participants, offering a visual that can help the group see or be reminded of their collective concerns and interests. Check out the Chattahoochee Oconee's Community Collaboration Project page to see how they are communicating virtually with stakeholders. Some great links, ideas, and good examples. You can also see the finished "graphic memory" from the Day 2 workshop.
Harvesting Products and Tools
- Placematters Smart Tables - The Helena Lewis and Clark and the Custer Gallatin National Forests are using these tables to support their public engagement efforts. These smart-board tables are interactive and allow for software that can display maps, capture comments, and make it easier for groups to see, navigate through and analyze data.
- The Grove Visual Planning Systems - The Grove sells graphic templates that can be used for many different purposes on their website. They also offer training for those who want to deepen their graphic recording skills.
- Pinterest Graphic Recording Pins – don’t forget this great online collector of ideas! Pinterest has many different collections of ideas, icons, templates and examples for you to peruse. A really great visual resource!